4.7 Inventory Management & Just-in-Time (JIT)
Examiner Focus: Master the 3 types of inventory (Raw Materials, Work-in-Progress [WIP], Finished Goods) and analyze the classic commercial trade-off between Inventory Holding Costs vs Stock-Out Costs. Master the interpretation and calculations of Inventory Control Charts (Maximum level, Reorder level, Buffer stock, Reorder quantity, Lead time). Evaluate the operational mechanics, benefits, and severe vulnerability risks of Just-in-Time (JIT) Lean Inventory Systems.
1. Real-World Case Dilemma
Case Context: A Singapore automotive spare parts distributor stocks S$10 million worth of spare gearboxes, brake pads, and windshields in a warehouse in Tuas:
Monthly warehouse rent, air conditioning, insurance, and interest on the bank loan used to buy the stock cost S$120,000 per month (Holding Cost).
An aggressive management consultant advises switching to Just-in-Time (JIT): sell off 90% of the warehouse stock, and order spare parts from suppliers only when a customer’s car breaks down.
Three months after adopting JIT, a container ship blocks the Suez Canal, international shipping halts for 4 weeks, car repair garages wait 35 days for brake pads, and angry taxi companies sue the distributor for lost commercial earnings.
Why is holding massive inventory financially expensive, yet eliminating inventory completely (JIT) potentially catastrophic in an interconnected global supply chain?
2. Key Terms & Jargon Decoder
| Syllabus Term | Plain English Meaning | Examiner Trap / Distinguishing Feature |
|---|---|---|
| Inventory (Stock) | The tangible goods and materials held by a business in reserve for production or sale. | 3 Types: Raw Materials (unprocessed inputs), WIP (semi-finished goods on the line), and Finished Goods (completed products ready to ship). |
| Inventory Holding Costs | The total recurring expenses of keeping physical stock stored: warehouse rent, electricity/refrigeration, insurance, security, deterioration/breakage, and capital opportunity cost (cash tied up in stock). | Typically costs 15% to 25% of the total inventory value per year! |
| Stock-Out Costs | The financial and commercial penalties of running out of inventory: halted factory assembly lines, missed delivery deadlines, lost sales, and customer defection to rivals. | Often far more destructive to long-term profitability than holding costs. |
| Buffer (Safety) Inventory | The minimum reserve level of stock deliberately held at all times to protect against unexpected demand surges or supplier delivery delays. | The safety net; prevents stock-outs during unexpected lead-time disruptions. |
| Lead Time | The time elapsed between the exact moment an order is placed with a supplier and when the physical goods arrive at the factory dock ready for use. | Longer/unreliable lead times force a firm to set a higher Reorder Level and hold more buffer stock. |
| Just-in-Time (JIT) | A lean operations philosophy where raw materials arrive from suppliers exactly when needed on the line, and finished goods are shipped immediately to buyers, reducing inventory to near-zero. | Eliminates storage waste, but requires 100% reliable suppliers, zero-defect quality, and predictable demand. |
3. Concept & Visual Anchor
Visualizing Stock Movement on the Inventory Control Chart
The stock level follows a classic sawtooth pattern: inventory is steadily consumed daily, crosses the Reorder Level, and is replenished by a fixed Reorder Quantity when the supplier's shipment arrives at the end of the Lead Time, always maintaining a Buffer Stock safety net at the bottom.
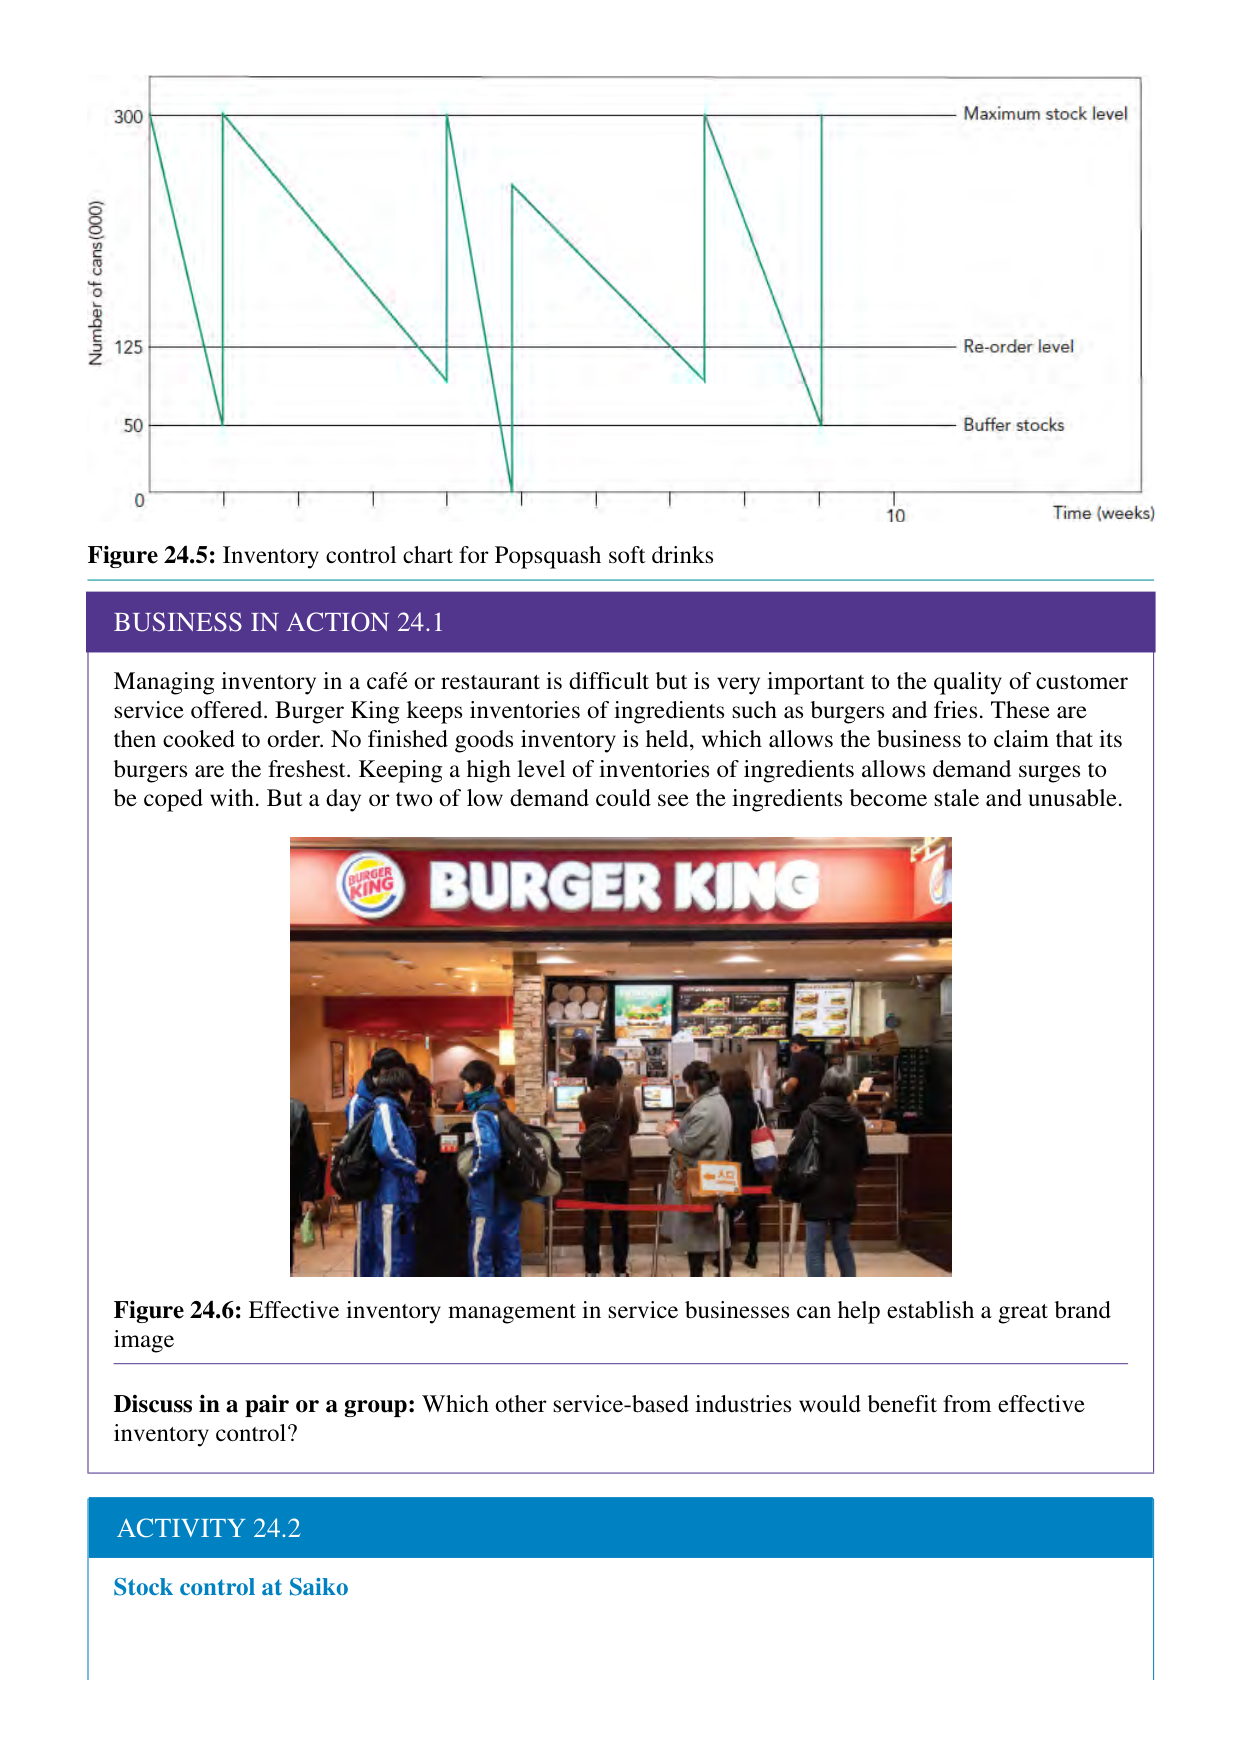
Core Anatomy of the Inventory Control Chart
\text{Reorder Level} = \text{Buffer (Minimum) Level} + (\text{Daily Usage Rate} \times \text{Lead Time})
\text{Maximum Inventory Level} = \text{Buffer Level} + \text{Reorder Quantity}
| Chart Parameter | Definition & Commercial Formula | Example (Swift Logistics Packaging) |
|---|---|---|
| 1. Maximum Level | The highest volume of physical stock the business will store (constrained by warehouse space and cash liquidity). | 1,000 boxes |
| 2. Buffer (Minimum) Level | The baseline safety reserve maintained to absorb sudden demand spikes or transport delays. | 100 boxes |
| 3. Reorder Level | The trigger point: when stock falls to this line, a purchase order is automatically dispatched to the supplier. | 400 boxes (Buffer $100$ + [100 \text{ usage/day} \times 3 \text{ days lead-time}]) |
| 4. Reorder Quantity | The fixed batch quantity ordered each time to replenish stock from buffer back to maximum level. | 600 boxes |
| 5. Lead Time | The operational time gap (in hours, days, or weeks) between placing the order and physical warehouse delivery. | 3 days |
The Fundamental Trade-Off: Holding Stock vs Holding Zero Stock (JIT)
| Dimension | Traditional Buffer Stock (JIC - “Just-in-Case”) | Just-in-Time (JIT Lean Inventory) |
|---|---|---|
| Inventory Holding Level | High safety buffer maintained at all times | Near-zero inventory; deliveries arrive on demand |
| Key Strengths | • Immune to supplier delivery delays • Exploits purchasing bulk discounts (§1.3) • Absorbs sudden customer demand surges |
• Zero warehouse rental and insurance costs • Releases working capital cash (§5.4) • Zero inventory spoilage and obsolescence |
| Critical Vulnerabilities | • Massive cash tied up in stored inventory • High storage rent, insurance, and deterioration |
• Highly fragile; single supplier delay halts factory • Forfeits bulk purchasing discounts |
4. Check Your Understanding
🧠 Quantitative Chart Diagnostic:
A Singapore commercial bakery uses flour for bread production:
- Normal daily usage = 200 kg of flour per day.
- Supplier Lead Time = 4 days.
- Management policy requires a Buffer Stock of 300 kg for emergencies.
- Reorder Quantity = 1,200 kg.
- Calculate the Reorder Level at which the bakery must place a new order.
- Calculate the Maximum Inventory Level.
- If an unexpected supply disruption increases Lead Time from 4 days to 6 days, calculate what happens to the Buffer Stock. Does a stock-out occur?
👉 Click to reveal model calculation & explanation
Reorder Level Calculation: \text{Usage during Lead Time} = 200 \text{ kg/day} \times 4 \text{ days} = 800 \text{ kg} \text{Reorder Level} = \text{Buffer Stock} + \text{Lead Time Usage} = 300 \text{ kg} + 800 \text{ kg} = \mathbf{1,100 \text{ kg}}
Maximum Inventory Level Calculation: \text{Max Level} = \text{Buffer Stock} + \text{Reorder Quantity} = 300 \text{ kg} + 1,200 \text{ kg} = \mathbf{1,500 \text{ kg}}
Lead Time Disruption Analysis:
- Total flour consumed during 6-day delayed lead time = 200 \text{ kg/day} \times 6 \text{ days} = 1,200 \text{ kg}.
- Stock available at reorder trigger = 1,100 \text{ kg}.
- Deficit = 1,100 \text{ kg} - 1,200 \text{ kg} = \mathbf{-100 \text{ kg}}.
- Conclusion: Yes, a stock-out occurs! The entire 300 kg buffer is completely exhausted, and the bakery runs out of flour on Day 5.5, shutting down the ovens for 12 hours.
5. Exam Error Surgery: Fix the Weak Answer
Paper 1 Section B Prompt (10 marks): Evaluate whether a manufacturing business should transition from traditional buffer inventory management to a Just-in-Time (JIT) system.
“JIT is always better because holding inventory is a complete waste of money. When a company uses JIT, it has zero inventory and does not need to pay warehouse rent, so profits become huge. Toyota uses JIT and is very successful. Therefore all companies should copy Toyota and use JIT.”
🔴 Examiner Red-Pen Diagnosis:
- Unrealistic Over-Simplification (): Assumes JIT is universally applicable to all companies regardless of supplier geography or product nature.
- Zero Supply Chain Risk Analysis (): Completely ignores transport chokepoints, strike risks, small-batch transport surcharges, and single-supplier dependency.
- No Evaluative Balance (): Reaches an absolute, uncritical conclusion.
[Analysis: Compelling Financial & Operational Benefits of JIT]
Transitioning to a Just-in-Time (JIT) inventory model delivers radical working capital and cost-efficiency gains (§4.4). By receiving components immediately before assembly and dispatching finished goods directly to customers, the firm eliminates physical warehouse leasing, insurance, climate-controlled storage, and inventory shrinkage (damage/theft) expenses. Furthermore, liquid cash previously tied up in non-productive inventory is released into working capital (§5.4), allowing the business to reduce short-term bank overdraft borrowing (§5.2) and avoid inventory obsolescence risks in fast-evolving industries.
[Analysis: Severe Supply Chain Vulnerabilities & Prerequisite Conditions]
However, JIT transforms a supply chain into a hyper-fragile operational network. JIT eliminates the safety buffer; a single late component delivery (e.g. caused by port customs delays, factory machine breakdowns, or transport strikes) instantly halts the entire assembly line, incurring catastrophic downtime costs. Furthermore:
- Frequent Small-Batch Transport Costs: Ordering small, daily batches forfeits bulk purchasing economies of scale (§1.3) and inflates freight delivery surcharges.
- Prerequisite Dependency: JIT requires three non-negotiable operational conditions: (a) Geographically proximate, 100% reliable suppliers; (b) Zero-defect Quality Assurance (§4.6); (c) Highly predictable customer demand. If any condition is absent, JIT triggers chronic stock-outs and customer defection.
[ Evaluative Judgment & Synthesis]
In conclusion, JIT is not universally superior:
- JIT is exceptionally effective for high-volume, standardized manufacturing (e.g. automotive assembly) situated within an integrated, highly reliable domestic supplier cluster.
- However, for firms relying on long-distance international maritime supply chains (§1.4) or operating in volatile, seasonal consumer markets, holding a disciplined buffer inventory remains the far safer, value-preserving operational strategy.
6. Strategic Evaluation Matrix
| Factor | Traditional Buffer Stock (JIC) | Just-in-Time (JIT Lean) |
|---|---|---|
| Supplier Geography & Proximity | International overseas suppliers (Long lead times: weeks/months). | Localized, geographically proximate supplier cluster (Lead times: hours). |
| Supplier Reliability & Relationship | Arm’s-length transactional; multiple competing suppliers. | Long-term single-source strategic partnership; integrated electronic data interchange (EDI). |
| Demand Predictability | Highly volatile, unpredictable, seasonal surges (e.g. fashion retail). | Highly stable, continuous, predictable production schedule. |
| Product Perishability / Obsolescence | Durable, non-perishable goods (e.g. metal fasteners). | High perishability (fresh sushi) or rapid technological obsolescence (microchips). |
7. “I Do / We Do / You Do” Exam Scaffolds
“I Do” Annotated Model Answer (12 marks)
Question: Evaluate the impact on a business of an increase in supplier lead time.
[/ Definition & Context]
Supplier Lead Time is the operational duration between placing a purchase order and receiving verified raw materials at the warehouse dock.
[ Analysis: Operational and Financial Impacts of Longer Lead Times]
When supplier lead times lengthen (e.g. from 3 days to 3 weeks due to geopolitical shipping disruptions), the business faces severe operational friction:
- Elevated Reorder Levels and Buffer Stock Requirements: To prevent production halts during the extended waiting period, management is mathematically forced to calculate a significantly higher Reorder Level (\text{Buffer} + [\text{Daily Usage} \times \text{Lead Time}]). The firm must hold significantly larger physical buffer inventory, inflating warehouse storage costs, insurance premiums, and working capital requirements (§5.4).
- Loss of Operational Agility: Long lead times force management to freeze production plans weeks in advance based on uncertain long-range sales forecasts (§3.3). If market demand shifts rapidly, the firm cannot pivot, resulting in over-ordering of obsolete inventory and stock-outs of trending items.
[ Analysis: Strategic Management Counter-Measures]
To mitigate longer lead times, management can execute strategic interventions:
- Supplier Dual-Sourcing / Nearshoring (§4.5): Contract alternative local or regional suppliers who offer short lead times, even if unit purchase prices are slightly higher.
- Digitized Supply Chain Integration: Implement automated Electronic Data Interchange (EDI) systems that automatically trigger purchase orders the moment stock crosses the reorder threshold.
[ Evaluative Judgment]
In conclusion, an increase in lead time represents a severe operational cost driver:
- It forces the firm to tie up cash in defensive buffer inventory, raising overall unit costs (AC).
- Management should evaluate whether the nominal unit purchase price savings from distant overseas suppliers justify the substantial inventory holding and disruption costs; in many cases, switching to nearshore regional suppliers delivers superior total economic value through compressed lead times.
“We Do” Guided Practice Scaffold
Question: Explain how an unexpected surge in customer demand impacts a business operating with an inadequate buffer stock level (6 marks).
Complete the analytical sentences using the provided sentence frames:
- [Exhaustion of Buffer Inventory] When customer demand suddenly surges beyond forecast, the inventory level drops rapidly below the reorder level, which means that \dots (Hint: explain why the inadequate buffer stock is completely consumed before the supplier’s lead-time shipment arrives).
- [Stock-Out & Lost Customer Lifetime Value] Once stock hits zero, the business experiences a stock-out, causing production to halt and \dots (Hint: explain how unfulfilled customer orders lead to contract cancellation penalties and permanent defection to competitors).
“You Do” Independent Exam Practice
25-Mark Essay Prompt: “Evaluate the view that minimizing inventory holding costs through lean operations is the most critical factor determining manufacturing profitability.”
Guided Success Criteria:
8. Self-Diagnosis & Retrieval Matrix
| Syllabus Sub-Topic | Can I explain in Plain English? | Can I provide a Singapore Case? | Can I evaluate the Trade-off? |
|---|---|---|---|
| 3 Types of Inventory (Raw/WIP/FG) | ⬜ | ⬜ (Bakery flour vs Baked loaves) | ⬜ (Inventory buffer vs Cash liquidity) |
| Holding Costs vs Stock-Out Costs | ⬜ | ⬜ (Tuas warehouse $120k holding cost) | ⬜ (Storage rent vs Lost sales penalty) |
| 5 Control Chart Parameters | ⬜ | ⬜ (Reorder level / Lead time calculation) | ⬜ (Buffer safety vs Capital tie-up) |
| JIT Operations & Prerequisites | ⬜ | ⬜ (Automotive line vs Suez canal shock) | ⬜ (Zero waste vs Supply chain fragility) |