5.3 Cost Allocation, Marginal Costing & Break-Even Analysis
Examiner Focus (Core Quantitative Calculation Unit): Master cost classifications (Fixed vs Variable, Direct vs Indirect). Understand the strategic applications of costing (Pricing, Profit calculation, Resource planning, Make-or-Buy decisions). Compare Full Costing vs Marginal (Contribution) Costing, and master all quantitative calculations and visual interpretations of Break-Even Analysis (BEQ, Margin of Safety, Target Profit, Break-Even Charts).
1. Real-World Case Dilemma
Case Context: A Singapore artisanal bakery operates with Monthly Fixed Costs of $12,000 (shop rent, baker salaries, equipment lease).
It bakes organic sourdough bread selling at $8.00 per loaf.
The direct variable cost per loaf (flour, yeast, electricity, paper packaging) is $3.00.
A private international school approaches the bakery offering a one-off contract to purchase 1,000 loaves for a school charity fair at $4.50 per loaf.
Full Costing says: “Reject the order! The total average cost per loaf is $6.00; selling at $4.50 creates a $1.50 accounting loss per loaf!”
Marginal Costing says: “Accept the order! Every loaf earns a positive $1.50 contribution toward profit!”
Who is right, and how does understanding Contribution guide short-term managerial decisions?
2. Key Terms & Jargon Decoder
| Syllabus Term | Plain English Meaning | Examiner Trap / Distinguishing Feature |
|---|---|---|
| Fixed Costs (FC) | Costs that do not change when production output increases or decreases (e.g. factory rent, manager salaries, insurance). | Fixed costs exist even when output is zero! |
| Variable Costs (VC) | Costs that change in direct proportion to the level of production output (e.g. raw ingredient flour, packaging boxes, delivery fuel). | Variable cost per unit remains constant; total variable cost rises with output. |
| Direct vs Indirect Costs | Direct: Clearly and exclusively traceable to a
specific product/unit (e.g. raw leather in a shoe). Indirect (Overhead): Shared costs that cannot be traced to one product (e.g. factory rent, cleaning bills). |
Cost allocation is the method of dividing shared indirect overheads among different products. |
| Contribution Per Unit | The surplus cash earned from each unit sold after paying its own direct variable cost: \text{Selling Price} - \text{Variable Cost Per Unit}. | Contribution is NOT profit! Contribution must first cover total fixed costs; only after fixed costs are fully covered does contribution become profit. |
| Full Costing | Allocating all costs (both direct variable costs and a share of fixed indirect overheads) to each unit of product. | Uses arbitrary allocation keys (e.g. floor area or labor hours), which can distort individual product profitability. |
| Marginal Costing | Allocating only direct variable costs to the product, treating all fixed overheads as a periodic lump-sum deduction. | The optimal tool for short-term special order pricing and make-or-buy decisions. |
3. Concept & Visual Anchor
Anatomy of the Break-Even Chart
- Fixed Costs (FC): A horizontal line parallel to the x-axis (FC is incurred even at zero output).
- Total Costs (TC): Starts at the FC intercept and slopes upward as variable costs are added (TC = FC + VC).
- Total Revenue (TR): Starts at the (0,0) origin and slopes upward (TR = P \times Q).
- Break-Even Point (BEP): The intersection where TR = TC. Below BEP is the Loss Area; above BEP is the Profit Area.
- Margin of Safety: The horizontal distance between current actual output and the Break-Even Quantity.
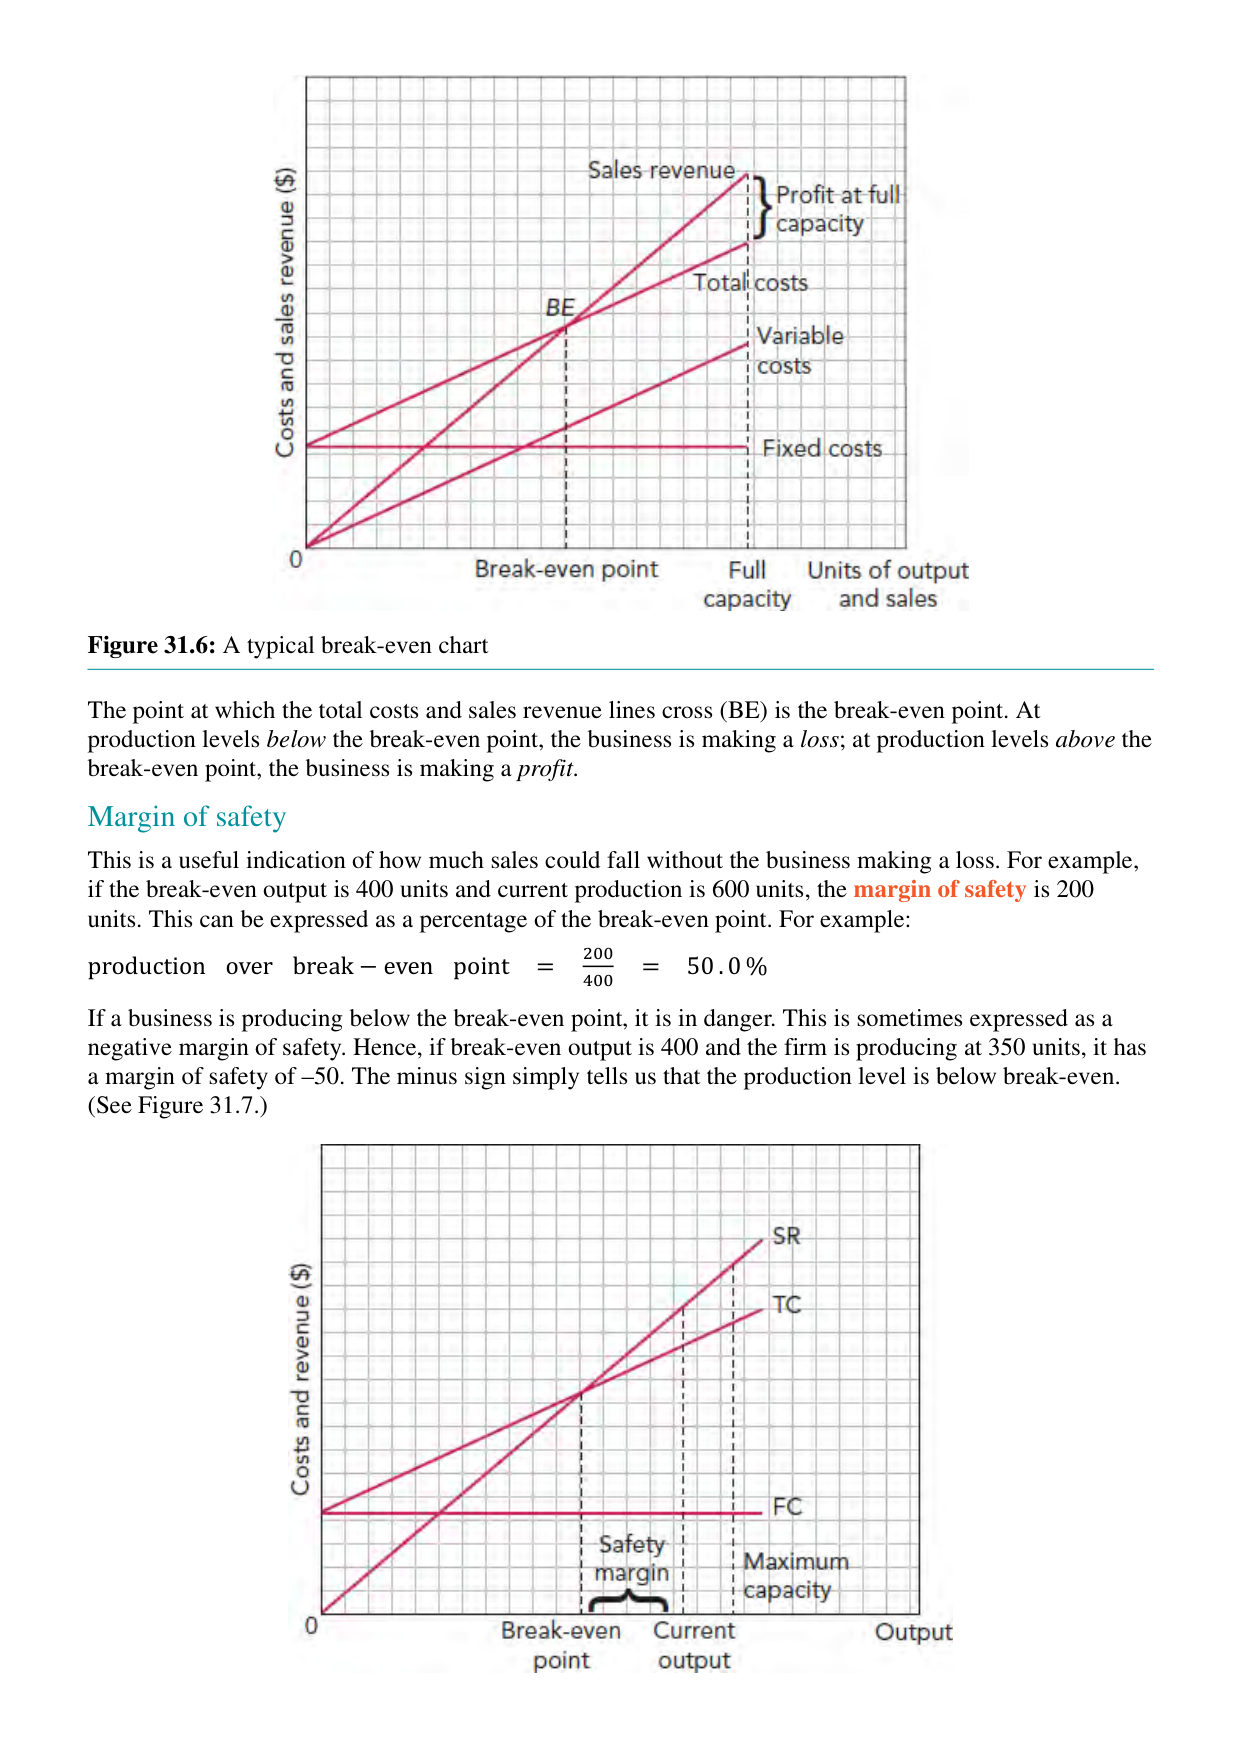
Master Quantitative Calculation Formula Bank
\text{Contribution Per Unit} = \text{Selling Price (P)} - \text{Variable Cost Per Unit (VC)}
\text{Total Contribution} = \text{Output Sold (Q)} \times \text{Contribution Per Unit}
\text{Break-Even Quantity } (Q_{BE}) = \frac{\text{Total Fixed Costs (FC)}}{\text{Contribution Per Unit (P - VC)}}
\text{Break-Even Revenue (S\$)} = Q_{BE} \times \text{Selling Price (P)}
\text{Margin of Safety (Units)} = \text{Actual / Planned Output} - Q_{BE}
\text{Margin of Safety (\%)} = \frac{\text{Actual Output} - Q_{BE}}{\text{Actual Output}} \times 100
\text{Operating Profit (S\$)} = \text{Total Contribution} - \text{Total Fixed Costs} = [Q \times (P - VC)] - FC
\text{Target Output for Desired Profit} = \frac{\text{Total Fixed Costs} + \text{Target Profit}}{\text{Contribution Per Unit}}
Full Costing vs Marginal Costing: The Strategic Decision Comparison
| Strategic Dimension | Full Costing (Absorption Costing) | Marginal Costing (Contribution Costing) |
|---|---|---|
| Cost Inclusions | Allocates direct costs + an allocated portion of fixed overheads to each unit. | Allocates strictly direct variable costs to the unit; fixed costs deducted as a lump sum. |
| Best Deployed For… | Long-Term Pricing Strategy: Ensures the selling price covers all long-term fixed overheads and capital depreciation. | Short-Term Tactical Decisions: Special one-off discount orders, spare capacity pricing, and Make-or-Buy choices. |
| Major Limitation | Arbitrary overhead allocation rules distort product profitability, leading to premature cancellation of viable products. | Danger of underpricing if used for long-term pricing (ignores fixed cost recovery). |
4. Check Your Understanding
🧠 Quantitative Calculation & Scenario:
Singapore beverage manufacturer Tropicool produces bottled cold-pressed fruit juices:
- Selling Price (P): S$6.00 per bottle
- Direct Variable Cost (VC): S$2.00 per bottle (Fruit S$1.40, Bottle S$0.40, Electricity S$0.20)
- Monthly Fixed Overheads (FC): S$40,000 (Factory rent, manager salaries, insurance)
- Current Monthly Output & Sales: 15,000 bottles
- Calculate the Contribution Per Unit.
- Calculate the Break-Even Quantity (BEQ) in bottles per month.
- Calculate the Margin of Safety in units and as a percentage.
- Calculate Tropicool’s current Monthly Operating Profit.
- If management targets a monthly operating profit of S$30,000, calculate the required sales volume.
👉 Click to reveal step-by-step model calculation
Contribution Per Unit: \text{Contribution} = P - VC = \text{S\$}6.00 - \text{S\$}2.00 = \mathbf{\text{S\$}4.00\text{ per bottle}}
Break-Even Quantity (BEQ): Q_{BE} = \frac{FC}{\text{Contribution}} = \frac{\text{S\$}40,000}{\text{S\$}4.00} = \mathbf{10,000\text{ bottles / month}}
Margin of Safety: \text{Margin of Safety (Units)} = 15,000 - 10,000 = \mathbf{5,000\text{ bottles}} \text{Margin of Safety (\%)} = \frac{5,000}{15,000} \times 100 = \mathbf{33.33\%}
Current Monthly Operating Profit: \text{Profit} = (15,000 \times \text{S\$}4.00) - \text{S\$}40,000 = \text{S\$}60,000 - \text{S\$}40,000 = \mathbf{\text{S\$}20,000}
**Target Output for S30,000 Profit:**\text{Target Output} = \frac{\text{S\$}40,000 + \text{S\$}30,000}{\text{S\$}4.00} = \frac{\text{S\$}70,000}{\text{S\$}4.00} = \mathbf{17,500\text{ bottles / month}}$
5. Exam Error Surgery: Fix the Weak Answer
Paper 1 Section A Prompt (8 marks): Explain why a business with spare factory capacity might accept a special one-off order at a price below its total average cost of production.
“A business should never sell below average cost because it will make a loss and lose money. But if it has spare capacity, it might accept just to make friends with the customer or clear old stock. Selling below cost is bad for profit.”
🔴 Examiner Red-Pen Diagnosis:
- Severe Conceptual Error (): Confuses Total Average Cost (AC) with Variable Cost (VC). Fails to understand Marginal Costing and Contribution.
- Flawed Analytical Mechanism (): Fails to calculate how any price above variable cost generates a positive contribution that directly increases total net operating profit.
- Informal Phrasing (): Uses non-business language (“make friends with customer”).
[Point]
A business with spare operational capacity should accept a special one-off order priced below total average cost (AC), provided the offered price exceeds the variable cost per unit (P > VC) and does not undermine regular market pricing.
[Explain - Marginal Costing Mechanism]
In the short run, total fixed costs (FC) are already committed and paid by the firm’s regular commercial sales. Therefore, the relevant cost to consider for an incremental order is strictly its direct variable cost (VC). When an offered special price exceeds variable cost (P > VC), each additional unit manufactured generates a positive Contribution Per Unit. This positive contribution flows directly toward covering total fixed overheads, thereby increasing total net corporate operating profit (or reducing overall net losses).
[Example - Bakery Case Grounding]
For example, if a bakery’s average total cost is S$6.00 (comprising S$3.00 variable cost and S$3.00 allocated fixed overhead), a special order offered at S$4.50 appears loss-making under Full Costing. However, under Marginal Costing, each loaf contributes S$1.50 (S$4.50 − S$3.00) above direct costs. Accepting an order for 1,000 loaves injects S$1,500 of net incremental profit that would otherwise be forfeited if the factory machinery sat idle.
[Evaluation Condition / Risk]
However, management must verify three critical conditions: (a) Factory spare capacity exists; (b) Regular customers paying the full S$8.00 price cannot access the discounted S$4.50 batch; (c) The buyer does not expect permanent discounts in the future.
6. Strategic Evaluation Matrix
| Strategic Decision | Use Full Costing When… | Use Marginal (Contribution) Costing When… |
|---|---|---|
| Setting Regular Retail Prices | ✅ Mandatory: Long-term prices must cover fixed overheads, depreciation, and profit margins. | ❌ Dangerous: Long-term marginal pricing leads to bankruptcy (fails to cover fixed rent and debt). |
| Special One-Off Orders | ❌ Misleading: Rejects profitable incremental revenue by allocating sunk fixed costs. | ✅ Optimal: Accepts any order where P > VC using spare, unutilized capacity (§4.5). |
| Make-or-Buy Component Decisions | ❌ Distorted: Allocates general factory overheads that will still exist even if the part is bought outside. | ✅ Optimal: Compares the external supplier price directly against internal variable avoidance costs. |
7. “I Do / We Do / You Do” Exam Scaffolds
“I Do” Annotated Model Answer (12 marks)
Question: Evaluate the usefulness and limitations of Break-Even Analysis as a decision-making tool for a business planning to launch a new product line.
[/ Definition & Context]
Break-Even Analysis calculates the exact production output volume where Total Revenue equals Total Costs (TR = TC), establishing the minimum sales threshold required to prevent operating losses.
[ Analysis: Strategic Benefits of Break-Even Analysis]
Break-Even Analysis provides senior executives with vital quantitative clarity during new product planning:
- Establishing Viability and Sales Targets: By calculating the Break-Even Quantity (Q_{BE} = \frac{FC}{P - VC}), management can evaluate whether projected consumer demand (derived from market research §3.3) is realistic. It provides marketing with clear sales targets.
- Margin of Safety and Risk Assessment: It quantifies the Margin of Safety—how far sales can fall before the product enters losses. A wide margin of safety reassures commercial lenders and investors (§5.2).
- “What-If” Scenario Modeling: Management can simulate the impact of rising commercial rents (higher FC) or supplier ingredient inflation (higher VC), adjusting retail prices proactively before committing capital.
[ Analysis: Critical Theoretical & Practical Limitations]
However, Break-Even Analysis operates on highly restrictive, unrealistic simplifying assumptions:
- Linearity Assumption: It assumes that selling price (P) and variable cost per unit (VC) remain completely constant at all output levels. In reality, selling higher volumes requires price discounting (§3.5), while purchasing raw materials in bulk unlocks purchasing economies of scale (§1.3), making revenue and cost lines non-linear curves.
- The “All Output is Sold” Fallacy: It assumes 100% of manufactured units are sold immediately, completely ignoring finished goods inventory holding costs and spoilage (§4.7).
- Single-Product Distortion: The standard break-even model assumes a single homogeneous product, whereas real enterprises sell diverse product mixes with shared indirect overheads.
[ Evaluative Judgment]
In conclusion, Break-Even Analysis is an invaluable first-stage financial planning screen, but an oversimplified operational guide:
- It is essential for determining baseline project feasibility and communicating financial risk to investors.
- However, management must dynamically update break-even calculations to account for stepped fixed costs, bulk discounts, and price elasticity, combining break-even with discounted cash flow Net Present Value (NPV §5.6) for final capital investment approval.
“We Do” Guided Practice Scaffold
Question: A manufacturing firm currently makes a plastic component internally at a variable cost of $4.00 and allocated fixed overhead of $2.00 (Total Full Cost = $6.00). An external supplier offers to supply the component for $4.80. Explain why the firm should continue making the component internally using marginal costing principles (6 marks).
Complete the analytical sentences using the provided sentence frames:
- [Marginal Cost Comparison] Under marginal costing, the relevant internal cost to compare is strictly the variable cost ($4.00), because the $2.00 fixed overhead will \dots (Hint: explain why factory rent and manager salaries will continue to be incurred even if production is outsourced).
- [Financial Consequence] If the firm buys from the supplier at $4.80, it will spend an extra $0.80 per unit in cash while still paying its existing fixed overheads, which will \dots (Hint: explain how outsourcing increases total corporate cash outflow and lowers profit).
“You Do” Independent Exam Practice
25-Mark Essay Prompt: “Evaluate the view that for a multi-product enterprise, marginal costing is vastly superior to full costing in guiding managerial pricing and resource allocation decisions.”
Guided Success Criteria:
8. Self-Diagnosis & Retrieval Matrix
| Syllabus Sub-Topic | Can I explain in Plain English? | Can I calculate from Memory? | Can I evaluate the Trade-off? |
|---|---|---|---|
| Fixed vs Variable Costs | ⬜ | ⬜ (Rent vs Ingredients) | ⬜ (High fixed cost operating gearing risk) |
| Direct vs Indirect Costs | ⬜ | ⬜ (Raw material vs Factory lighting) | ⬜ (Arbitrary allocation distortion) |
| Contribution Per Unit Formula | ⬜ | ⬜ (P - VC) | ⬜ (Contribution vs True profit) |
| Break-Even Quantity (Q_{BE}) | ⬜ | ⬜ (FC \div [P - VC]) | ⬜ (Linearity assumption vs Real discounts) |
| Margin of Safety | ⬜ | ⬜ (\text{Actual} - Q_{BE}) | ⬜ (Risk buffer vs Ambition) |
| Full vs Marginal Costing | ⬜ | ⬜ (Special order acceptance math) | ⬜ (Short-term contribution vs Long-term viability) |